
What are Open Position Ratios and Which Ones to Use

In forex Open Position Ratios are a sentiment indicator showing the percentage of traders that have open positions, long or short, in a specific currency pair.
- Sentiment indicators show the percentage of long and short positions held by retail traders on an asset
- Market sentiment can help identify trading opportunities
- When a sentiment indicator reaches 70% it can signal that the majority of the retail traders are opening positions against the trend
- Knowing that 90% of retail traders lose money while trading CFDs, considering a contrarian market position to the majority of the traders can be an option
Sentiment Indicators
Open position rations show the correlations and dependency between the positions taken by retail traders and it helps understand future market trends. When trading a forex pair, it's worth noting that if you are trading the EUR against the CHF, you are also trading derivatives of the EUR/USD and the USD/CHF pairs, and for this reason, these pairs are correlated with each other.
It is also worth mentioning that some currencies tend to move in the same direction, while others move in the opposite direction. Read our article Currency Pair Correlation to find out more.
We already have discussed four topics of the Forex Correlated Sentiment Indicators:
- Put/Call Ratio (Currency Futures Options)
- Open Interest (Currency Futures)
- COT (Currency Futures)
- Volatility via VIX (S&P500 Options)
We will now look at the 3 best sentiment indicators, or open position rations, and how the data from these indicators can be used to analyse the forex sentiment and the emotions of retail investors; the net amount of optimism, or pessimism, reflected in any asset's performance.
OANDA Sentiment Dashboard
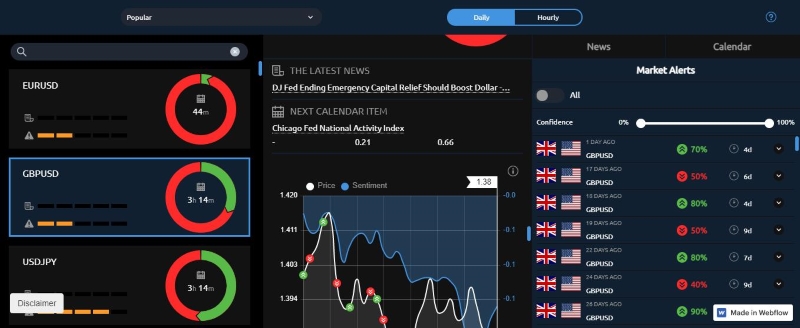
OANDA provides a visually attractive dashboard that breakdowns the in-house sentiment and open positions for the major currency pairs, updated hourly and daily.
The left side of the dashboard displays an easy-to-understand sentiment gauge, showing which positions retail investors are taking on a range of instruments.
Then, the middle column displays the historical data, allowing traders to see how historical sentiment compares with the underlying price action for the selected instrument. The greyed-out area, with the white line, is the price line. The blue zone with the blue line represents the direction of the retail trader's sentiment.
The right column of the dashboard shows the upcoming events. This part of the OANDA Sentiment Dashboard allows traders to monitor upcoming events and see how a variety of instruments have previously traded at current sentiment levels.
OANDA Sentiment Dashboard Contrarian Signal
OANDA does not provide any specific contrarian recommendations in relation to the ratios above, but anyone familiar with the sentiment theory knows that one can use the long-short ratios graph to trade counter the crowds.
Whenever the ratio shows that longs are greater than 50%, then, the crowd sentiment is bullish on that pair, and one can take that as a sign to be bearish.
Whenever the ratio shows that shorts are greater than 50%, then, the crowd sentiment is bearish on that pair, and one can take that as a sign to be bullish.
The ratio is more powerful the greater the percentage above the 50% mark, such that if longs are showing up as 70% then that means that the crowd is extremely bullish and more likely to be wrong.
Moreover, the ratio is powerful when it flies against the dominant trend; for instance, if the EUR/JPY is 70% long (extremely bullish), and the dominant trend is down, then it means that the crowds are buying aggressively into Euro/Yen losses, giving the contrarian signal that the pair could hit further lows.
The only drawback ot the OANDA tool is that the OANDA Sentiment Dashboard shows the in-house data, derived from the positions of their own clients, and this makes the ratios limited in scope, as they do not reflect the the global market sentiment, or the numbers of the retail consumer industry as a whole.
Source: OANDA Sentiment Dashboard
Dukascopy SWFX Sentiment Index
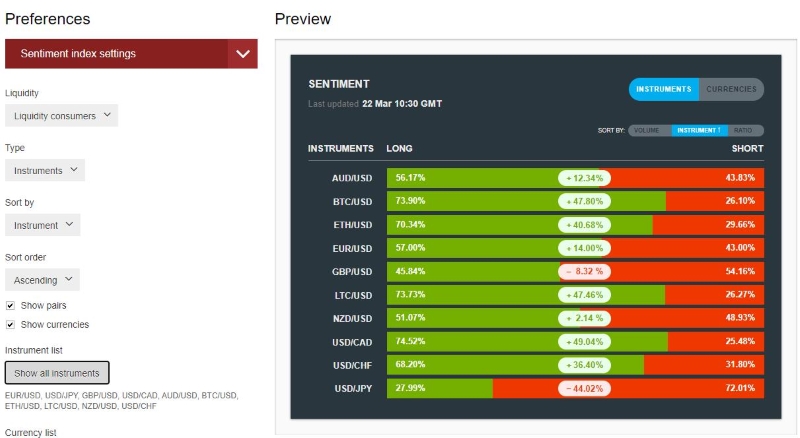
The Dukascopy Sentiment Index is another useful tool providing the in-house percentile ratio of longs versus shorts of its consumers (i.e., retail traders) and providers (rate providers), and since it is the consumers that are considered the “uninformed” participants, one is going to trade counter to them.
The index is divided by long traders and short traders' ratios. The left side of the index shows the long positions ratios and the right side the ratios for short positions for each of the major currency pairs. The middle percentage shows the last change in sentiment; retail traders adding more longs (percentage in green) or retail traders adding more shorts (percentage in red).
Note that the percentages always add up to 100%. The settings (click the red cog wheel at the right top corner) can be changed to include other instruments; indices, commodities, stocks, and even the major crypto currencies crosses, loke BTC/USD and LTC/USD.
Dukascopy Sentiment Index Contrarian Strategy
Dukascopy considers their indicator to be a good contrarian indicator and gives the example of it acting as an additional confirmation filter to approve or disapprove trading signals originating from an MA crossover.
For example, if the MA strategy gives a buy signal, and the sentiment indicator for the EUR/USD and EUR are oversold, one can avoid that position; conversely, if the indicator is oversold and the MA strategy gives a sell signal you have more probability of success.
When using this sentiment index, please note that Dukascopy does not give any hints as to what ratio values constitute overbought or oversold levels, so one has to make a guess. Also, consider that the displayed ratios are in-house, derived from the positions of their own clients, and this makes the ratios limited in scope, as they do not reflect the numbers of the retail consumer industry as a whole.
Regarding this index, Dukascopy does not provide much historical context. The percentile ratios and changes can only be seen at the moment of viewing them. The widget attempts to publish the changes of ratios as they occur from the last update, but how useful are these percentile changes if there is no archiving of the ratios and their changes in a spreadsheet or chart?
Without a proper historical database and charting application, there is little possibility of effectively gauging from past ratios the extreme levels that price has turned around upon, and thus what levels constitute the extremes that can be used for an effective contrarian strategy.
Source: Dukascopy SWFX Sentiment Index
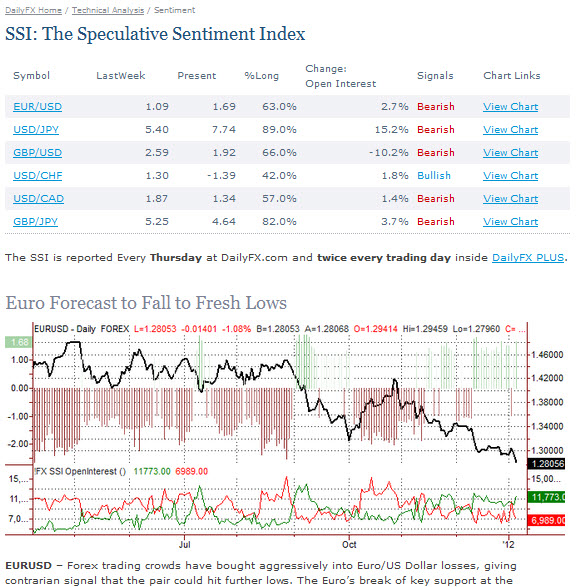
IG Client Sentiment
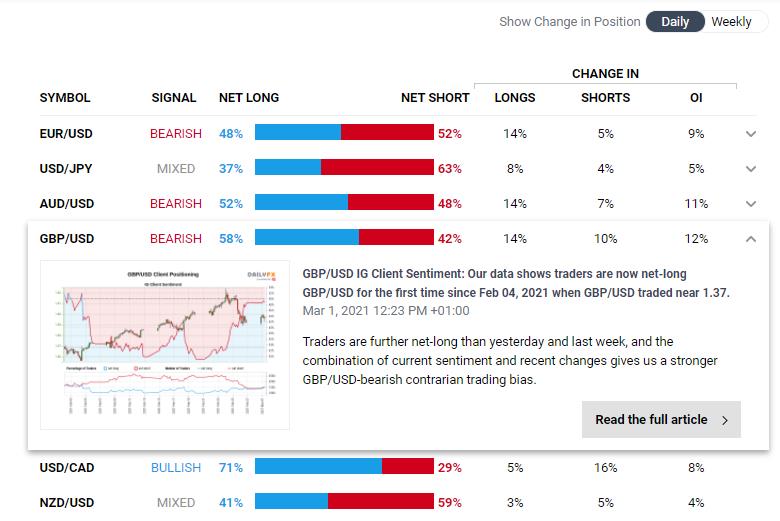
This IG Client Sentiment index shows the percentage of traders long (Net Long) and short (Net Short), the percentage change over time (Change In), and whether market signals are bullish or bearish.
The IG Client Sentiment is provided in partnership to DailyFX and provides an in-house ratio of longs versus shorts of IG's own clients, and since they are considered the “uninformed” participants one is going to trade counter to them.
IG strives to provide more useful information than Dukascopy and OANDA. It delivers the present ratio along with the percentage long and the percentage change in open interest.
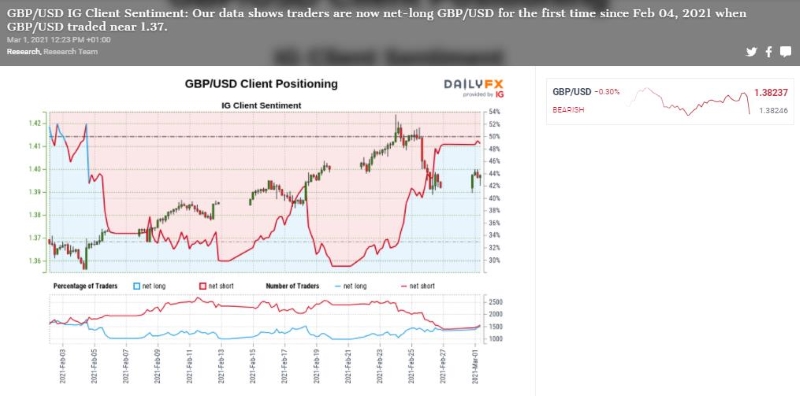
But that's not all. When clicking the arrow down of the selected instrument, the index goes to a new page prepared by IG's research team, where traders can find a chart with all the data for nearly the past 30 days, with the percentage of traders long and short, and the number of trades, long and short.
IG research team also adds a summary to the instrument sentiment underneath, and it gives a bullish or bearish signal backed up by a qualitative description of the signal’s relationship to other technical analysis considerations.
IG Client Sentiment Contrarian Strategy
IG considers their indicator to be a good contrarian indicator. Whenever the ratio is above 50%, it means that the sentiment is bullish and thus a bearish signal is given. Whenever the ratio is below 50%, the sentiment is bearish and thus a bull signal is given.
The strength of the bullish or bearish signal is dependent on the percentile degree above or below the 50% mark, along with the percentage change from last report.
The signal is also powerful if the ratio stands against the dominant trend; for instance, if EUR/USD is 57% bullish, and the dominant trend is down, then it means that the forex trading crowds are buying aggressively into Euro/US Dollar losses, giving the contrarian signal that the pair could hit further lows.
The expanded IG Client Sentiment, for example for the Major GBP/USD, looks like this:
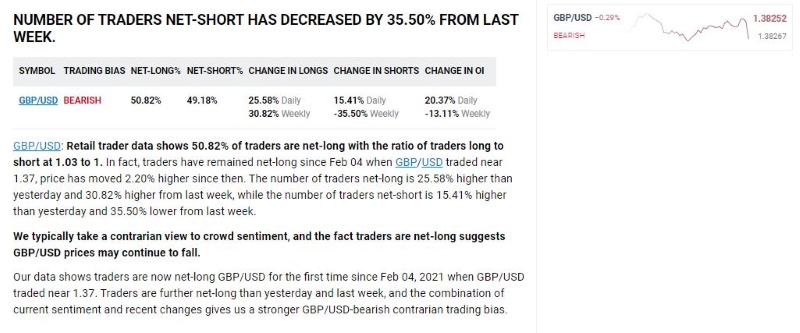
Please note that the IG Client Sentiment, in collaboration with DailyFX, represent the ratios derived from the positions of IG's own clients, and as this makes the ratios limited in scope, they do not reflect the overall numbers of the retail consumer industry as a whole.
DailyFX/IG does provide a currency pair chart that has the percentage and the number of traders plotted underneath, but this chart is limited to nearly the past 30 days. Also, there is no handy archive of previous ratios, and there is no track record of the success or failure of the IG’s signals generated by their Client Sentiment indicator.
Source: IG Client Sentiment
Conclusion
Sentiment indicators are a great tool to see what the retail traders are doing, by looking at how bullish or bearish they are, and what they are feeling regarding the trend.
These invaluable tools can help traders forecast and identify turning points on a trend and its future behaviour. Usually, when the data and the sentiment readings are extremely high or low, traders may begin positioning themselves in a contrarian way.
Statically 90% of retail traders lose money when trading FX. One of the main reasons is that retail traders tend to be trend fighters. It is part of the human nature and this logic will never change.
Retail traders, by nature, try to anticipate the markets tops and bottoms by trading reversals in strong trending markets. This goes completely against the fundamental concept of trading with the trend.
The other important reason we must consider is that if the market is in a strong downtrend and traders’ sentiment is, the majority, long, all those long traders will need to do the opposite to close their longs, which involves a sell order to close their positions, creating selling momentum that will benefit short traders, not long traders.
But don’t just open a position contrary to the market sentiment, as sometimes the sentiment is according to the trend. Check the market sentiment and confirm the trend on your charts, possibly with the aid of the RSI, to evaluate if the market is currently oversold or overbought, and if there’s room for the trend to continue.
Do you use a sentiment indicator on your trading strategy? Share your thoughts, or strategies, on the comments box below.
 Copy Link
 Share on Facebook
 Share on X
 Share by Email

