What is Ichimoku Kinko Hyo

You might have seen or heard about the beautiful looking Ichimoku Kinko Hyo indicator ((Ichimoku Kinkō Hyō, or, simply, Ichimoku), with its eye-catching moving averages and dynamically unfolding clouds.
The name translates from Japanese to “Equilibrium chart at a glance,” aptly describing how its five separate components come together to form a “whole” picture of price action to be seen “at a glance”. One simple look at an Ichimoku chart is said to provide its practitioners with an immediate understanding of sentiment, momentum and trend strength. Discover how to use it in this complete article.
The background story is intriguing. While an indicator is usually formulated by statisticians or mathematicians in the industry, this indicator was, strangely enough, developed before WWII by a Tokyo newspaper writer named Goichi Hosoda and a handful of assistants running multiple calculations.
After 20 years of testing, Mr. Hosoda finally released the system to the public in a book published in 1968. The indicator has been used extensively in Asian trading rooms since Hosoda published his book, though it did not make its appearance in the West until the 1990s.
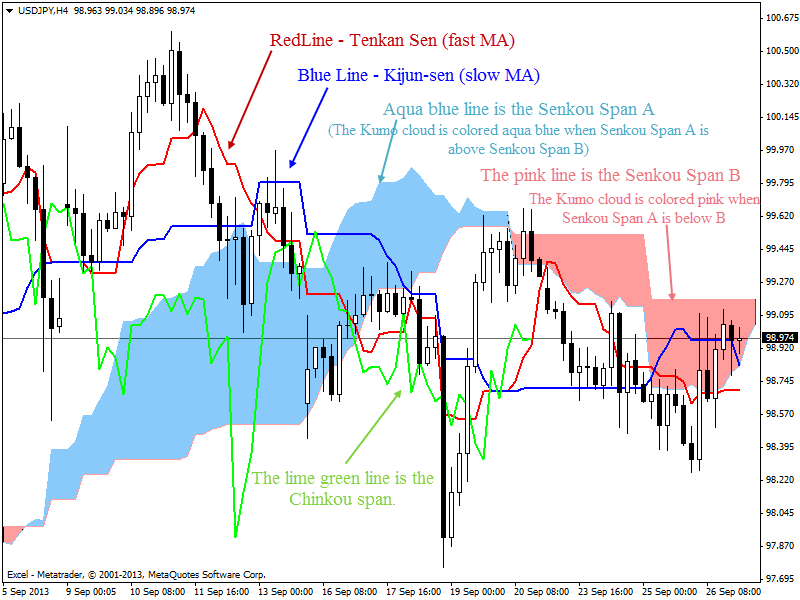
The Ichimoku Kinko Hyo indicator consists of five main elements:
- Tenkan-sen (“turning line”): a 9-period fast moving average based on High-Low difference rather than traditional Close levels,
- Kijun-sen (“standard line”): a 26-period slow moving average based on High-Low difference rather than traditional Close levels,
- Senkou Span A (“1st leading line”): average of Tenkan-sen and Kijun-sen plotted with some shift in the future,
- Senkou Span B (“2nd leading line”); average of maximum and minimum price for the given period plotted with the same shift in the future,
- Chinkou Span (“lagging line”): price Close level plotted with the same shift but in the past.
Senkou Span A and B together form what is known as Kumo cloud.
The chart below shows the five elements in their complete set-up:

Apparently, there are different ways to trade with Ichimoku Kinko Hyo: one can trade the Tenkan/Kijun cross, like the MACD, or trade the Kumo cross, or trade the cross of price with any of Ichimoku’s five lines.
For the longest time, the strategies were traded manually, but if you are a trader who desires proof of a system’s profitability in the form of back-tests, in combining the web for different versions of the EA – we found the ones listed below. The EAs below on two pairs, USDJPY and EURJPY, on H4 time frame, from January 01 2008 to September 27 2013.
EA Name | Logic | Backest: USDJPY@H4 (Jan 1, 2008 – Sept 27, 2013) | Backtest: EURJPY@H4 (Jan 1, 2008 to Sept 27, 2013) |
---|---|---|---|
IchimokuEA_v1.3 | Works on 3 Strategies, singularly or together:
| ![]() 738 (3664 DD), PF:1.03, 493 trades (50% Win) ★☆☆☆☆ | ![]() 3800 (2800 DD), PF:1.13, 634 trades (53% Win) ★★☆☆☆ |
Ichimoku5.3.3 | Tenkan Sen / 34-EMA Cross
| ![]() 1760 (800 DD), PF:1.56, 118 trades (74% Win) (Note: hour 1-9 works best in test) ★★★★☆ | ![]() 3500 (930 DD),PF:1.49, 300 trades (75% Win) ★★★★☆ |
Ichimoku-Chinkou-Cross | Buys (sell) when Chinkou crosses over (under) the close
| ![]() 1060 (2076 DD), PF: 1.09, 373 trades (35% Win) ★☆☆☆☆ | ![]() 3800 (3560 DD), PF: 1.22, 333 trades (38% Win) ★★☆☆☆ |
There was hardly a consistent and rigorous method of providing back-testing for any of the above EAs when they were first developed by their authors. At best the EA was back-tested on one instrument over a period of 1 year, which is scant evidence of the EA’s reliability. We had to find and download the latest versions of the above EAs and conduct our own back-tests on two pairs, USDJPY and EURJPY, on H4 time frame, from Jan 01, 2008 to Sept 26, 2013, observing that those two pairs and that timeframe works particularly well for that system.
There are some promising EAs based on Ichimoku, such as the Ichimoku 5.3.3 EA.
We are going to give you yet one more version of Ichimoku EA that should help you in your trading.
We are calling it ForexRazor Ichimoku-EA and it uses the idea of the Chinkou span crossover. It has one signal condition and two optional confirmation conditions.
Signal Condition = Buy (sell) If current Chinko is above (below) the close and previous Chinkou was below (above)
Confirmation Condition1 = Buy (sell) if close is above (below) both Senkou Span A and Senkou Span B
Confirmation Condition2 = Buy (sell) if Chinkou span is above (below) both Senkou Span A and Senkou Span B
Here are the results of the EA:
![]() | ![]() |
2620 (867 DD), PF: 1.56, 207 trades (37% Win) ★★★☆☆ | 2732 (1190 DD), PF:1.47, 181 trades (32% Win) ★★★☆☆ |
2500 pip return with 1000 pip drawdown over 200 trades since 2008 is decent, if not spectacular. You know that the EA is likely to be modestly profitable over the long run.
Conclusion
For decades the Ichimoku Kinko Hyo system had been a manual system meant for the trader to see at a glance the interaction and balance of each of its five main indicator lines in order to capture medium term trends.
But the problem with manual systems is that they hard to quantify: one cannot know for sure how well they have done in the past, or how well they might work out in the future. Moreover, the Ichimuku system has many variations on how to trade it, from taking a crossover or confirmation from any or all of the five line elements, and it is hard to know for sure which variation works the best.
However, in the last few years, there has been scattered attempts to build EAs of the different variations, though the thoroughness of the back-testing left much to be desired.
We have dug up several EAs that have tried to tackle the Ichimoku system in different ways, and when we conducted back-tests on USDJPY and EURJPY on the H4 time frame, we discovered there were some interesting EAs that had made some noteworthy profits in the last 6 years. These are nice to add to one’s arsenal.
We also created one additional variant of the Ichimoku EA – playing off the Chinkou crossover, and hopefully that EA can help you as well.
We give a deep bow to Mr. Hosoda for being the Clark Kent of his time – being the newspaper man during the day and the “superman” strategy developer at night (albeit helped by a few assistants). He accomplished an incredible feat from observation and manual testing. Now that we have computers and strategy testers loaded with 10 years of historical data, we can see that the system he gave us over 40 years ago is still very much profitable today – or at least some particular variations of the system on particular pairs and timeframes.